“Observed Changes in Extreme Temperature over the Global Land Based on a Newly Developed Station Daily Dataset” was published in Journal of Climate (IF = 4.66) on November 15. It is an achievement of Prof. REN Guoyu’s team from the Department of Atmospheric Sciences, School of Environmental Studies. The first author is doctoral student ZHANG Panfeng, and REN is the corresponding author.
This paper presents an analysis of changes in global land extreme temperature indices (1951–2015) based on the new global land surface daily air temperature dataset recently developed by the China Meteorological Administration (CMA). The linear trends of the gridpoint time series and global land mean time series were calculated by using a Mann–Kendall method that accounts for the lag-1 autocorrelation in the time series of annual extreme temperature indices. The results, which are generally consistent with previous studies, showed that the global land average annual and seasonal mean extreme temperature indices series all experienced significant long-term changes associated with warming, with cold threshold indices (frost days, icing days, cold nights, and cold days) decreasing, warm threshold indices (summer days, tropical nights, and warm days) increasing, and all absolute indices (TXx, TXn, TNx, and TNn) also increasing, over the last 65 years. The extreme temperature indices series based on daily minimum temperatures generally had a stronger and more significant trend than those based on daily maximum temperatures. The strongest warming occurred after the mid-1970s, and a few extreme temperature indices showed no significant trend over the period from 1951 to the mid-1970s. Most parts of the global land experienced significant warming trends over the period 1951–2015 as a whole, and the largest trends appeared in mid- to high latitudes of the Eurasian continent.
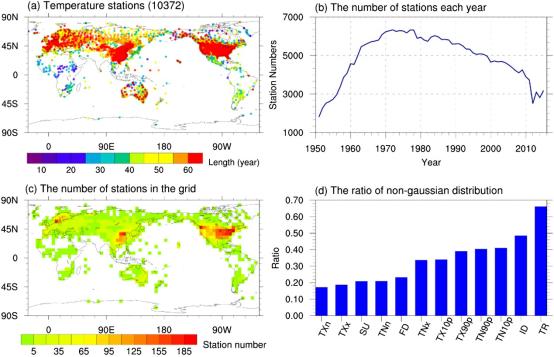
Fig. 1. (a) Locations of temperature stations used in this study. The colors represent the length of time series of stations. The number in parentheses indicates the total number of stations. (b) The number of stations each year. (c) The number of stations in the grid. (d) The station ratio of non-Gaussian distribution for each of the 12 extreme temperature indices.
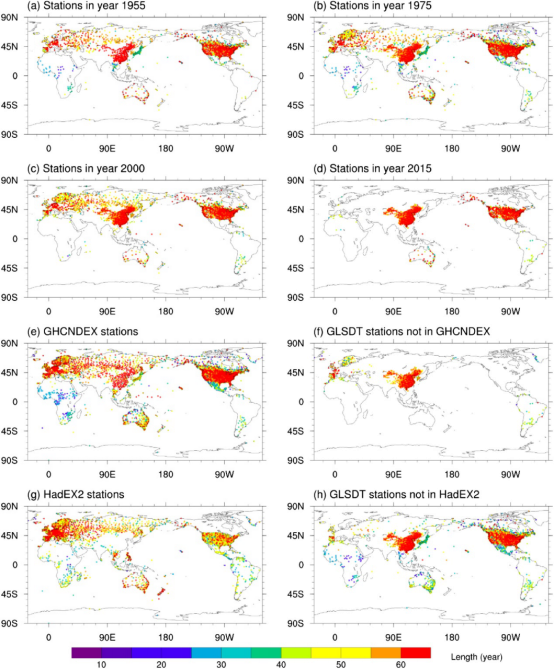
Fig. 2. (a)–(d) The stations distribution in the years 1955, 1975, 2000, and 2015. (e)–(h) The stations of GHCNDEX and HadEX2 (Donat et al. 2013a,b), and the corresponding temperature stations that are included only in GLSDT dataset but not in GHCNDEX and HadEX2, respectively. All the selected stations have at least 15 years of nonmissing data during the reference period 1961–90. The station record length refers to the length of nonmissing data from 1951 to 2015.
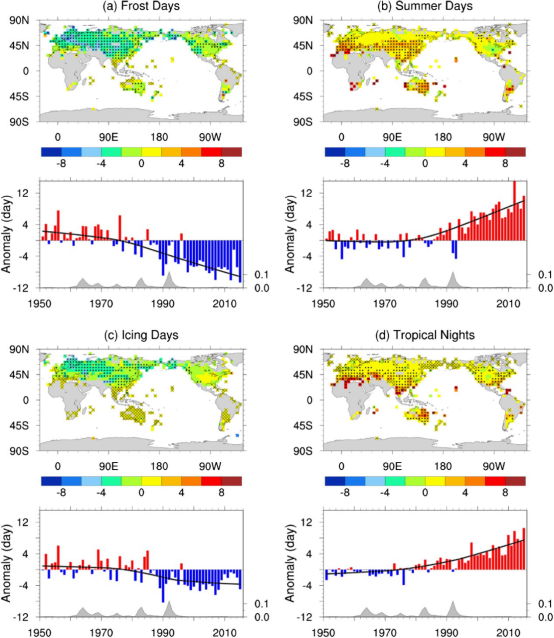
Fig. 3. Trends distribution of grid average annual extreme temperature indices (day decade−1) and global land average time series of annual anomalies relative to the reference period (1961–90) average (day) over 1951–2015 for (a) frost days (FD), (b) summer days (SU), (c) icing days (ID), and (d) tropical nights (TR). Trends were calculated only for the grid boxes that have at least 40 years of data during the study period and the last year of the data does not occur before 2000. The global average time series were calculated using only the gridcell series that have at least 90% of data during 1951–2015. Stippling indicates the gridcell trends are significant at the 5% level. Cross marks indicate the gridcell series with only zero values, i.e., no extreme events occurred in the entire time series. The black smooth curves on the bar chart were obtained by using the locally weighted scatter smoothing (LOWESS) method (Cleveland 1979). Gray shading presents the time evolution of global average aerosol optical depth series at 550 nm (Sato et al. 1993).
Full Text: https://doi.org/10.1175/JCLI-D-18-0733.1