“Fractal Dimension, Lacunarity and Succolarity Analyses on CT Images of Reservoir Rocks for Permeability Prediction” is published in Journal of Hydrology (Volume 579, December 2019, 124198). It is an achievement of Prof. CAI Jianchao’s team from the School of Geophysics and Geomatics. The first author is doctoral student XIA Yuxuan, and CAI is the corresponding author.
An explicit relationship between seepage properties and microscopic structure of porous media is being sought for the development of oil and gas resources. An effective method to accurately characterize and quantify the microscopic structure of porous media is a key issue. Fractal geometry can take advantage of several physically-based parameters to analyze microstructures of reservoir rocks. In this study, three fractal structural parameters, fractal dimension, lacunarity and succolarity, were employed to characterize scale-invariant complexity, heterogeneity, and anisotropy of rock microstructures, respectively. Twelve three-dimensional digital cores of sandstone reservoir rocks were used to evaluate permeability in terms of fractal dimension, lacunarity and succolarity. The parameters were utilized to quantitatively characterize differences in core micro-structure and predict their effects on permeability. Due to the confounding influence of porosity, the fractal dimension was not an accurate predictor of the variation in permeability on its own. Instead, the results reveal that lacunarity and succolarity were better able to predict differences in structure and permeability. Succolarity, in particular, showed an exponential relationship with permeability, yielding a coefficient of determination of 0.940. Using a combination of fractal structural parameters in the place of pore-size distribution, can provide a better explanation of the relationship between fluid flow, and the heterogeneous structure and anisotropic physical properties of reservoir rocks.

Fig. 1. Original twelve Micro-CT images (I(1)-(12)), two-dimensional cropped original Micro-CT images (I2(4), (8) and (12)) and two-dimensional processed binary Micro-CT images (P2(4), (8) and (12)) of sandstone core samples with low, intermediate, and high porosities. The pore space and the rock skeleton are shown as black and white, respectively. A central 5123 μm3 volume was extracted for analysis from each of the original CT images.

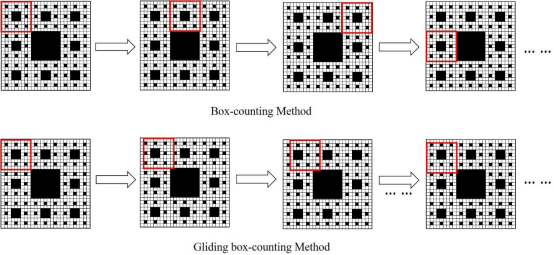
Fig. 2. The schematic of box-counting and gliding box-counting methods. The measurement box shown in red is 92 in each case. The difference between these two methods is the distance of the measuring box moves each time, the distance of box moving in box-counting method is the length of box edge, the distance of box moving in gliding box-counting method is the length of pixel of image. (For interpretation of the references to colour in this figure legend, the reader is referred to the web version of this article.)

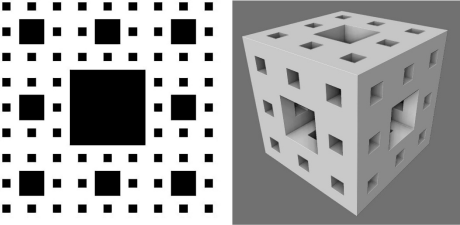
Fig. 3. Representations of the third-order Sierpinski Carpet (on the left) and the second-order Menger Sponge (on the right).
Full Text:https://doi.org/10.1016/j.jhydrol.2019.124198